Moving Average Definition:
Moving averages are indicators that pave or soften a greater or lesser extent, the evolution of prices, so that eliminate certain fluctuations, whether short, medium or long term. A moving average is represented by a line to be calculated as an average or mean value of a given set of prices or quotations; and is movable as it changes or moves with the data to be added for each trading day. Moving averages are always represented on the price chart. Moving averages can be built for any period of time, whether minutes (on an intraday chart), days, weeks, months, semesters and years. Hence, you can incorporate moving averages on intraday, weekly, monthly, etc.
The Concept of Moving Average:
We all have read about averages in mathematics textbooks and this is just an extension of averages. To determine moving averages, we add the closing price of a stock for 10 days and divide it by ten (the number of days). Similarly, we determine the moving averages by determining the average closing price for last ten days. On the eleventh days, we will exclude the closing price for day 1 and include the closing price for day 11. This averages will show some fluctuation on every coming day, hence is called moving averages.
We discussed about volume indicator in the previous chapter and learnt how it helps to determine a trend of financial markets. In this chapter we will get to know the moving averages, types of moving averages and strategy of moving averages indicator. Also we will learn how moving averages chart patterns help in indentifying trend of stock market, forex market, currency market or commodity market.
How to use a Moving Average to Buy Stocks?
The period used for the moving averages depends on the investment horizon of the operator, investor or manager. A short-term investor, a speculator or an operator of trades upon moving averages used a few days, a maximum of 30 days. While a person who is not interested in short-term movements of the values and wants to take advantage of medium-term movements chooses a moving averages between 50 and 70 days. Finally, a stock trader concerned solely on long-term trends elects half a period exceeding 150 days, who isn’t interested in the movements in the short and medium term.
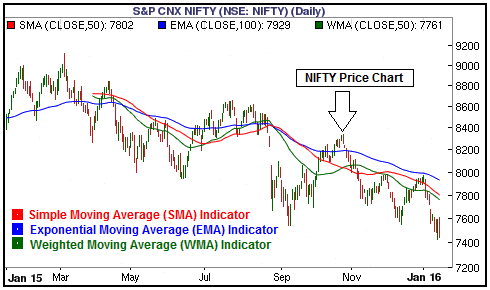
Here in the chart shown, you can see the examples of moving average indicators like: simple moving average indicator (SMA), exponential moving average indicator (EMA) and weighted moving average indicator (WMA) in detail.
Technical Analysis – Different Types of Moving Averages:
In general, moving averages are constructed from closing data of stocks, but may be constructed from the following price data sessions:
1. Moving averages from closing prices: For its construction, chart is prepared by taken only the closing prices of the session whether daily, weekly, monthly, etc.
2. Moving averages from maximum prices: Taking into account the maximum prices of each session for its construction.
3. Moving averages from the minimum prices: Taking into account the minimum prices for each session for its construction.
4. Moving averages from average prices: The averages taken as a reference value arithmetic mean between the maximum and minimum of each session.
And from this information you can build any of the following various different types of moving averages:
- The Simple Moving Average (SMA).
- The Weighted Moving Average (WMA).
- The Exponential Moving Average (EMA) or Exponentially Weighted Moving Average (EWMA).
- The Triangular Moving Average (TMA).
- The Volume Adjusted Moving average (VAMA).
- The Variable Moving average (VMA).
- The Time Series Moving average (TSMA).
While the moving averages used are more simple, the weighted and exponential.
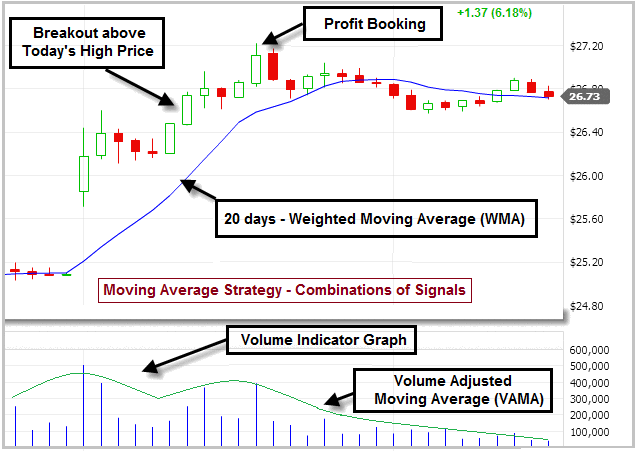
Moving Average Strategy – Combination of Signals:
When the market is trending, such indicators tend to give good signals and allow you to enter the market early giving you the chance to grab most of the movement. However during consolidation periods, a system of moving averages crossings offers many false signals. Therefore it is important to determine in advance the trend in each scenario. If there is any trend so we use a system that serves during the periods of that trend, if there is no any trend so we use another system to serve in periods of consolidation.
Remember that signals that we get about moving averages are very sensitive to the number of periods chosen. Taking short periods, our system allows us to get to market faster and will have more signs, but also will have many false signals. If, on the other hand, if we choose longer periods, we will have fewer signs and we will come later, but our signals will be more accurate. In the next chapters, we will discuss various technical indicators and impact of technical indicators on trading sessions.
Read E-Learning Tutorial Courses - 100% Free for All
Basics of Technical Analysis for Beginners
- Chapter 1: What is Technical Analysis? Definition with Examples
- Chapter 2: Technical Analysis: Types of Technical Chart Patterns
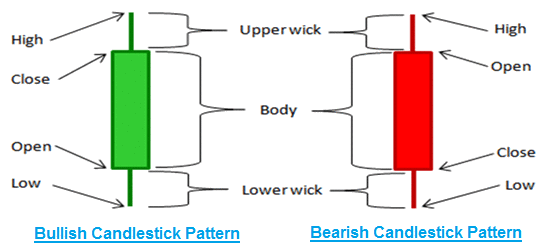
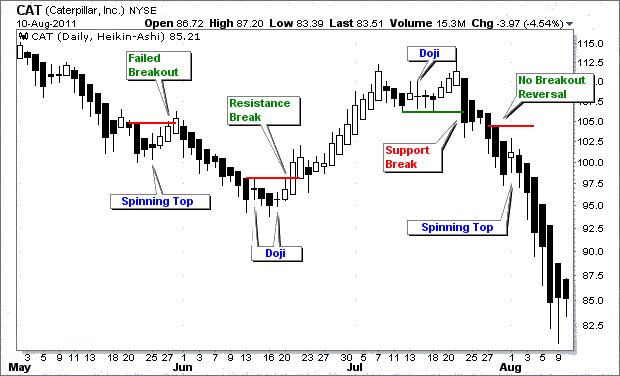
- Chapter 3: What is Candlestick Chart? Definition with Examples
- Chapter 4: Types of Single Candlestick Patterns. Definition with Examples
- Chapter 5: Definition, Examples, Types of Multiple Candlestick Patterns
- Chapter 6: What is Support and Resistance? Definition and Examples
- Chapter 7: What is Volume? Definition with Examples of Indicators
- Chapter 8: What is Moving Average? Definition, Examples, Types and Strategy
- Chapter 9: What are Technical Indicators? Definition with Examples
- Chapter 10: Different Types of Technical Indicators with Examples
- Chapter 11: Basics of Technical Analysis Quiz - Question and Answers