The amount that a financial asset has traded over a given time period is measured by its trading volume. Based on the total number of shares traded in a stock, volume is calculated. The quantity of contracts traded in futures and options trading determines the volume. Traders use volume to assess liquidity, and they combine volume changes with technical indicators to determine which trades to enter.
By observing volume trends over time, you can determine the level of assurance that underlies specific stock and market gains and losses. The same is true for option traders because trading volume reveals the current level of popularity of a particular option. In fact, volume plays a significant role in technical analysis and is prominently present in a number of important technical indicators.
Volume Definition
Basically, the volume is the amount of shares traded (bought & sold) over a given time period. For example, if you decide to buy 50 shares of Reliance Communications and someone decide to sell 50 shares of Reliance Communications. You both will make a deal at a specific price and trading will take place. Many people mistake the volume to 100 (50+50), but that’s not true. Total number of volumes is 50 here.
The volume is an indicator of great importance and helps us with crucial information on selling or buying the stock. In the previous chapter, we came to know the support and resistance levels that impact the open and close prices of a stock. In this chapter, we will discuss the volume indicators and will know what does it means in technical analysis.
Important Role of Volume in Technical Analysis
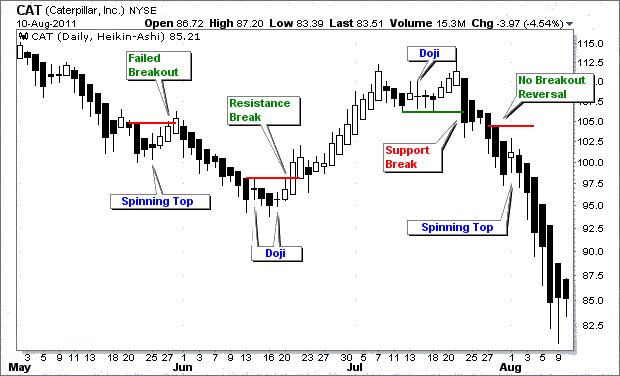
In the technical analysis, we all know that the most complicated thing of a value is to know how it’s going to behave when approaching an area of support or resistance. If the rebounds at these levels were perfect, everybody would win money in rebounds in support and resistance, but reality is quite different from this situation.
Volume indicators are much commonly used in Forex trading and stock market, where it provides an accurate indication of the health of the trend. So if we have a growing trend, we also have a strong growing trend and then a volume in stock market or Forex trading.
The volume pattern does not indicate other than the strength of the trend and ignores its direction. So it does not take into account the direction of the trend, but only force.
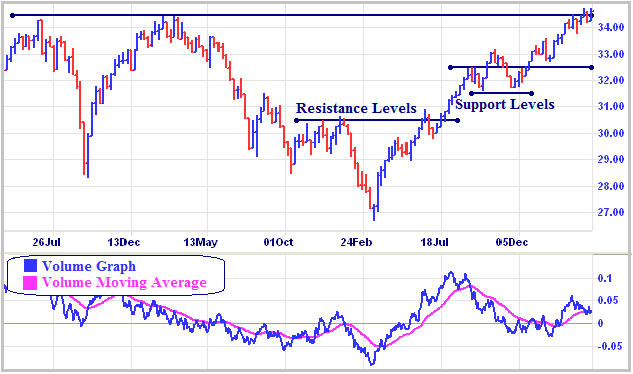
In this above technical analysis chart pattern, we can see an example of volume indicator of the stock along with price chart, support and resistance of the stock in detail.
Volume Indicators in Technical Analysis
The trade volume index (TVI) detects whether a stock is bought or sold, the company that provides a clear picture of the amount of the purchase and sale of each title. In the event that the volume of trade index is growing, we have a greater number of traders willing to buy; otherwise, we will have a downward trend and then a lot more traders willing to sell. Therefore, lets check based on below situations.
Example of Volume Indicator
Suppose price increases and volume down: we are in a situation where the trend is running out of their own strength; thus giving as result two observations:
- Large volumes which indicate the strong presence of investors and traders as a result of the market.
- Low volumes indicated for a particular asset, special interests. In this case there is no interest, either on the part of buyers, is part of the sellers. So traders are at a standstill.
In summary we have:
- The volume indicator is simply a diagram synthesizing want market interest, especially when we operate with a pair of currencies.
- The indicator not only confirms the strength or weakness of a trend;
- Trend indicates growing interest of traders;
- Decreasing trend shows little interest.
Extreme peaks may indicate a timely investment. The analysis conducted so far have noted that indicators focus more change in volumes rather than price, based on which are the daily operations of an asset.
Usually, these volume indicators are used by the professionals. Quite the contrary, long-term investors are less concerned about data intraday and focus solely on the note as security will close at the end of the day.
How to Negotiate Volume Indicators?
According to Richard Russell, it does nothing but tend to increase in the vicinity of a main direction of the trend. The book is simply one of the best tools for all traders who want to invest your money in a stock or ETF. In general, the volume of a trend that can be analyzed through two instruments:
- The Trend Line.
- Moving Averages.
No matter what kind of time frame you choose to use, as it can be used time: weekly, daily, Intraday, monthly, yearly, etc. If we face a chart, the level of analysis must necessarily follow that we define as pricing. That is, if we are operating through an uptrend, this should be in tune with the higher prices.
Otherwise, if it were a downward trend, the price must make a series of highs and lower lows. It can also happen that you have to be a formation of bullish or bearish indicator between volumes and prices that can alert you of important changes in the trend divergences.
What is On-Balance Volume (OBV)?
Here is some important information regarding volumes that will help you with trading the stocks.
1. Again, it is noteworthy that the idea behind this indicator is that it precedes price movements. If the volume begins to decline when the price of an asset is on the rise this is indicative of an increase in selling pressure, which if it continues, may cause the price begins to fall. The opposite is also true when the volumes has increased during periods when the price rises, which is a sign of increased buying pressure.
2. When analyzing this indicator, the trader must focus primarily on its trend. The current value of OBV (on-balance volume) has no more relevance in the sense that it includes lots of data from the past and there is a relative comparison between the OBV a tool and another. Moreover, if we study the recent trend of OBV, we can determine if the pressure of purchase or sale is rising or decreasing or confirm an existing trend in the market or identify a divergence between the indicator and price.
3. If the OBV is moving in the same direction of the prevailing trend, is a clear sign that it strengthens the trend continues. On the contrary, when the OBV starts moving against the trend, it is an indication that the trend is weakening and can be reversed.
4. On-balance volume example, when the volumes of the stock is not up during periods when the price is higher, we interpret this as a weakness in buying pressure. If buying pressure decreases, it is unlikely that the uptrend remains sustainable for longer.
5. In order to confirm a change in trend with on-balance volume trading strategy, usually a moving average period OBV 20 is employed. In this case, when the OBV crosses the moving average of 20 periods, divergence signal of a trend reversal is confirmed.
6. The On-Balance Volume is one of the less complex indicators that try to measure both price and volume together. Comparing to other more complex indicators, this is easier to understand and use for which it has become extremely popular.
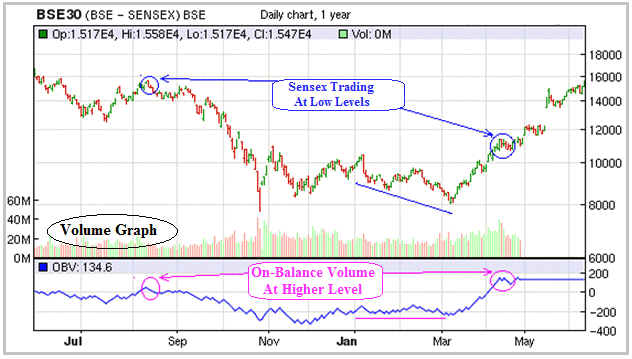
In the above technical chart of BSE Index, we can see an example of on-balance volume indicator of the stock index along with volumes chart and price price in detail. In the next chapter, we will discuss the moving averages and will come to know how it differs from normal average we learnt in mathematics textbooks.
Read E-Learning Tutorial Courses - 100% Free for All
Basics of Technical Analysis for Beginners
- Chapter 1: What is Technical Analysis? Definition with Examples
- Chapter 2: Technical Analysis: Types of Technical Chart Patterns
- Chapter 3: What is Candlestick Chart? Definition with Examples
- Chapter 4: Types of Single Candlestick Patterns. Definition with Examples
- Chapter 5: Definition, Examples, Types of Multiple Candlestick Patterns
- Chapter 6: What is Support and Resistance? Definition and Examples
- Chapter 7: What is Volume? Definition with Examples of Indicators
- Chapter 8: What is Moving Average? Definition, Examples, Types and Strategy
- Chapter 9: What are Technical Indicators? Definition with Examples
- Chapter 10: Different Types of Technical Indicators with Examples
- Chapter 11: Basics of Technical Analysis Quiz - Question and Answers