When two or more distinct candlestick formations appear within a specific timeframe, it’s known as a multiple candlestick pattern. This phenomenon reflects shifts in market dynamics and gives traders a more comprehensive understanding of price action. By recognizing and understanding these integrated patterns, traders may make better decisions regarding entry, exit, and risk management strategies. Let us look into the multiple candlestick patterns definition with examples and their types.
The relevance of various candlestick patterns in technical analysis is examined in this introduction, along with an examination of their forms, characteristics, and useful implications for traders negotiating the intricacies of financial markets. Knowing the intricacies of different candlestick patterns can help identify trend continuations, reversal signals, and potential consolidation periods, among other things, which can greatly enhance one’s comprehension of market behavior and trading opportunities.
Multiple Candlestick Patterns Definition
Technical analysts employ candlestick patterns because they offer crucial information about the state of the market and future price movements. With remarkable precision, traders and analysts may identify trends, reversals, and market hesitation using these patterns. The ability of many candlestick forms to depict intricate market dynamics over several trading sessions makes them particularly significant. In multiple candlestick patterns, there are two or more candles to indicate the trading behavior of the stock.
We will discuss the trading types of candlestick patterns in this detail topic. In previous chapter, we knew about various single candlestick patterns including bullish marubozu, bearish marubozu, the spinning top and doji. There are various different types of multiple candlestick patterns that use several candles to portray the trading behavior. Let us understand multiple candlestick chart patterns starting with the engulfing patterns.
Types of Multiple Candlestick Patterns
Here we will discuss about various types of multiple candlestick patterns with examples:
Engulfing Candlestick Pattern
Definition: An engulfing pattern is the candlestick pattern that utilized two candles to indicate the trading behavior of two sessions. A typical engulfing pattern consists of two candles including a small candle to show the trading behavior of day one and a comparatively longer candle to show the trading behavior of day two. Let us understand about engulfing pattern firstly from one of the types of multiple candlestick patterns.
There are mainly types of engulfing patterns: candlestick bullish engulfing pattern and candlestick bearish engulfing pattern.
Bullish Engulfing Candlestick Pattern
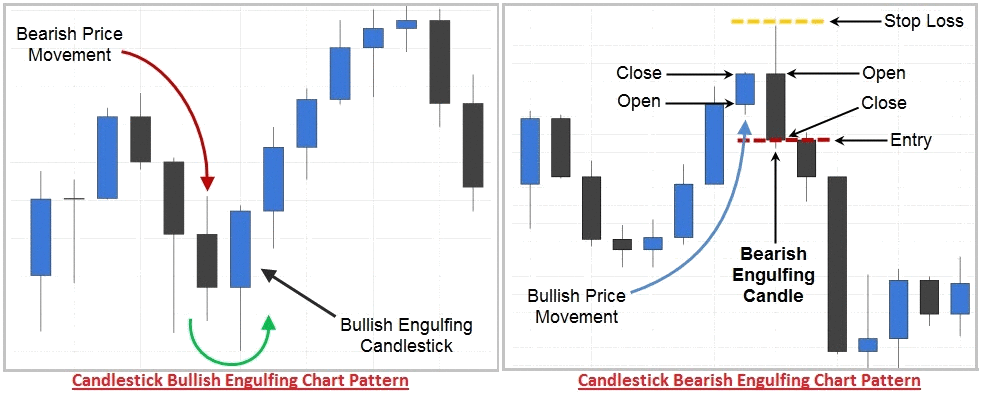
In a bullish engulfing pattern, the first candle is a bearish candle the second candle is a bullish candle. The bullish candle is relatively longer than the bearish candle and totally engulfs the real body of bearish candle. The bullish engulfing pattern occurs in the bottom of a trend, not in middle or top.
Unlike Spinning Top and Doji, which we learned in the previous chapter, the bullish engulfing pattern does not represent indecision in the market but a situation where control has shifted from sellers to buyers. The long body of the current candle that completely engulfs the body of the previous candle represents that buyers have not only taken over, but they have done it by force. As such, when this pattern is for a bearish trend in the market; is seen as a signal that the trend may be reversing.
There are some conditions where traders typically see a greater potential for reversal if:
- The longer the blue candlestick and smaller the black candle that precedes it, the greater the potential reversal.
- When the blue candle completely surrounds the black candle in front.
- When large volume is formed during the period when the blue candle.
In the above chart pattern formation, we can see the example of bullish engulfing candlestick pattern and example of bearish engulfing candlestick pattern in detail.
Bearish Engulfing Candlestick Pattern
In a bearish engulfing pattern, the first candle is a bullish one and the second candle is a bearish one. The bearish candle is relatively longer than the bullish candle and totally engulfs the real body of bullish candle. Generally, the bearish engulfing pattern occurs in the top of a trend.
A bearish engulfing pattern is similar to a bullish engulfing pattern, but the colors or candles are exchanged. The bearish engulfing pattern when viewed in an uptrend is representative of a possible reversal of this trend. The pattern consists of a black and blue candle, where the last candle (black color) opens higher than the previous candle (blue candle) and closes below the opening of the previous candle. When this happens, the black candle in the current period completely engulfs the blue candle body for the previous day or session.
There are several instances where traders typically see a greater potential for reversal, this happens when:
- The longer the black candle color and smaller the blue candle that precedes it, the greater the potential reversal.
- When the black candle completely engulfs the blue candle in front.
- When large volume is formed during the period of the red candle.
Piercing Candlestick Pattern
Definition: A piercing pattern isn’t much different than a bullish engulfing pattern. However, the difference is that in a piercing pattern, the bullish candle doesn’t engulf the bearish candle completely. The bullish candle may engulf more than half portion of a bearish candle but it doesn’t engulf the bearish candle completely.
After identifying this pattern within a downtrend, the upward shift in trend causes candles to group in this manner. It’s essential to note that this pattern emerges only during a prolonged decline in prices, which is termed a downtrend; otherwise, its validity is compromised.
To identify more precisely a grouping such bullish candlestick character, we must be attentive to the formation of three candles through available will help us know a quick way to locate this shift in prices on a chart:
- The formation appears compulsion behind the development of a downtrend in prices generally.
- The appearance of the first candle will be clearly bearish nature; indeed the body is extensive due to the big drop in prices.
- The next candle opens below the minimum indicated by the first candle chart pattern; however, the price clearly turns upward, reaching the second candle’s closing point, which is above half of the previous range.
- Do not confuse this pattern with the pattern “bullish engulfing” candle, since the difference is that in this case not exceed ends of the body above the previous candle.
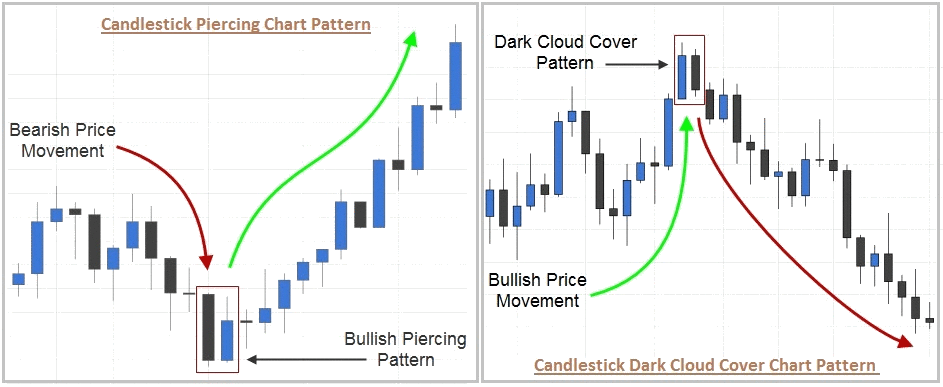
In the above chart pattern formation, we can see the example of bullish piercing candlestick pattern and example of dark cloud cover candlestick pattern in detail.
Dark Cloud Cover Candlestick Pattern
Definition: The above named pattern is a “bearish reversal candlestick pattern”. We call it a bearish candlestick pattern, because it indicates a signal for the beginning of a downward movement. When a dark cloud cover forms on the chart, it indicates that the prices are much more likely to decrease.
In the reversal candlestick pattern, a dark cloud cover forms at the top of an uptrend, or several of the preceding candlesticks may exhibit bullish behavior. When formed at the top of an uptrend, it shows the bulls’ exhaustion signal indicating an incoming bearish attack.
A dark cloud cover candlestick chart patterns has two candles. The first candle has to be a bullish candle, and the second one that is the main candle in this pattern, will be a bearish candle.
The second candle opens a little higher the closing price of the first candle. And then it goes all the way down, and closes little above the open price of the first candle.
Harami Candlestick Pattern
Definition: In Japanese, Harami means pregnant. Here in a Harami pattern, two candles form a shape together that looks like a pregnant woman standing. A Harami candlestick chart patterns are formed by two candles together. The first is a large candle in direction of movement or trend. The second candle is against. Candles may have small shadow or having nothing of shadow. The second candle’s body must be within the body of the first candle. Although of the second candle’s body is smaller than the body of the first, its size should be larger than normal so that the harami has a good strength.
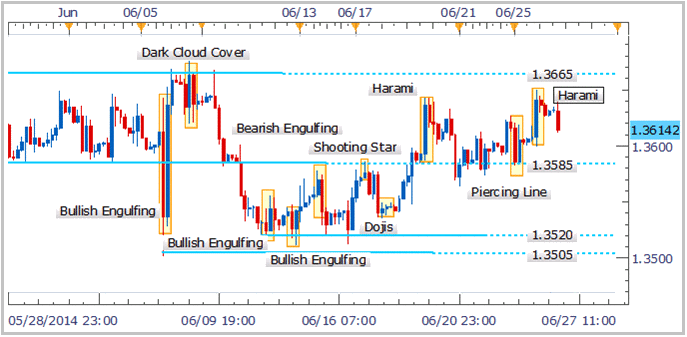
In the above chart pattern formation, we can see the example of bearish harami candlestick pattern, bullish engulfing pattern, bearish engulfing pattern, piercing pattern in detail.
Bullish Harami Candlestick Pattern
A bullish harami pattern is a two-candle formation. The formation is more likely to occur following a preceding downward trend, indicating a shift towards bullish sentiment. In a downtrend, a substantial red candle body emerges, closing below its opening. The next candle body appears blue, with its close above the opening. The blue candle completely encompasses the body of the preceding red candle, along with its shadows, within its own structure.
In a bullish harami candlestick chart pattern, the first candle is red and the second candle is blue. The important thing is that the second candle is contained in the body of the first. A particular case is the Harami Cross, where the second candle is a doji.
Bearish Harami Candlestick Pattern
A bearish Harami pattern is a formation of two candles that occurs after an uptrend, suggesting a change of bearish trend. It must be formed in an uptrend where a large blue candle body (closing above the opening) appears. The next candle has a red body, which means it closes below the opening. It encompasses all the content within the body of the previous blue candle, including shadows.
In a bearish harami candlestick chart pattern, the first candle is blue and the second candle is red. The important thing is that the second candle is contained in the body of the first. A bearish harami gives important information about the market and signals a trader that it may an opportunity to start small trades.
Conclusion
Lastly, traders and technical analysts can benefit greatly from the use of several candlestick patterns. Compared to individual forms, these patterns reveal more details about the emotions of the market and potential price movements. Traders can enhance their comprehension of market dynamics by identifying and interpreting candlestick pattern sequences or combinations. They can improve the quality of their trading decisions through this process.
Read E-Learning Tutorial Courses - 100% Free for All
Basics of Technical Analysis for Beginners
- Chapter 1: What is Technical Analysis? Definition with Examples
- Chapter 2: Technical Analysis: Types of Technical Chart Patterns
- Chapter 3: What is Candlestick Chart? Definition with Examples
- Chapter 4: Types of Single Candlestick Patterns. Definition with Examples
- Currently Reading: Definition, Examples, Types of Multiple Candlestick Patterns
- Chapter 6: What is Support and Resistance? Definition and Examples
- Chapter 7: What is Volume? Definition with Examples of Indicators
- Chapter 8: What is Moving Average? Definition, Examples, Types and Strategy
- Chapter 9: What are Technical Indicators? Definition with Examples
- Chapter 10: Different Types of Technical Indicators with Examples
- Chapter 11: Basics of Technical Analysis Quiz - Question and Answers