Definition

Definition of Financial Planning: A broad term used to describe Financial Terms, Banking Terms, Accounting Terms, Trading Terms, Accounting Terms and many more…

Multiple Candlestick Patterns – Definition, Examples, Types

Wikipedia of Finance - e-learning course on Technical Analysis Wikipedia Chapter - Types of Multiple Candlestick Patterns? Definition with Examples of Bearish and Bullish Engulfing Candlestick Chart Patterns - Types of Multiple Candlestick Patterns? Definition with Examples of Bearish and Bullish Engulfing Candlestick chart Patterns

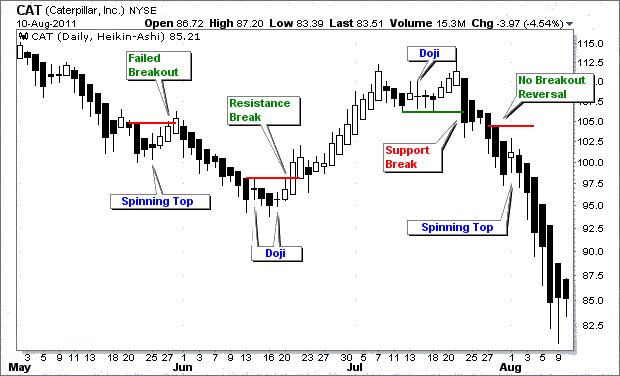
When two or more distinct candlestick formations appear within a specific timeframe, it’s known as a multiple candlestick pattern. This phenomenon reflects shifts in market dynamics and gives traders a more comprehensive understanding of price action. By recognizing and understanding these integrated patterns, traders may make better decisions regarding entry, exit, and risk management strategies. […]

Multiple Candlestick Patterns – Definition, Examples, Types Read More »

Technical Analysis: Different Types of Single Candlestick Patterns. Definition with Examples

Wikipedia of Finance - e-learning course on Technical Analysis Wikipedia Chapter - Types of Single Candlestick Patterns - Definition with Examples - Doji Candlestick Pattern and Spinning Top Candlestick Pattern

Single Candlestick Pattern Definition: In a single candlestick pattern, there is only one candle to show the trading action for the day. The length of the candle shows the trading implication. The longer a candle is the more will be the selling or buying activity. Similarly, a shorter candle portrays less trading activity. Let us

Technical Analysis: Different Types of Single Candlestick Patterns. Definition with Examples Read More »

What is Candlestick Chart in Technical Analysis? Definition with Examples

Wikipedia of Finance - e-learning course on Technical Analysis Wikipedia Chapter - What is candlestick chart? Definition with examples learn Bullish and Bearish Candlestick pattern of technical analysis

A candlestick chart, a type of financial chart, displays changes in a currency’s, a security’s, or a derivative’s price. It resembles a candlestick because of its vertical rectangle and wicks at the top and bottom. The top and bottom of the candlestick represent the open and closed prices, respectively. The wick’s top and bottom represent,

What is Candlestick Chart in Technical Analysis? Definition with Examples Read More »

What is Technical Analysis? Definition with Examples

Wiki Finance pedia - e-learning course on Technical Analysis Wikipedia Chapter - Technical Analysis Definition and Examples

Technical Analysis Definition: Before we answer the question, let us know what an analysis called is. Basically, an analysis is a detailed examination of the elements or structure of a particular subject. But, here we will discuss the examination of securities and investment decisions that are majorly categorized into two parts: fundamental analysis and technical analysis.

What is Technical Analysis? Definition with Examples Read More »

ULIP Plan – Benefits, Advantages and ULIP Calculator

United Linked Insurance Plans - ULIP Plan - ULIP Calculator - Features, Benefits, Advantages of ULIP - Wikipedia of Finance

When you start a job, plans for your future start to take shape. Things like investment options and insurance policies become a part of your daily concerns. While you surely know about different Insurance Plans, Best Term Insurance Plans, Unit Linked Insurance Plan (ULIP Plan) and various schemes to invest in, have you heard about

ULIP Plan – Benefits, Advantages and ULIP Calculator Read More »