What is Equity Research? Definition, Examples, Analyst Report on Analysis
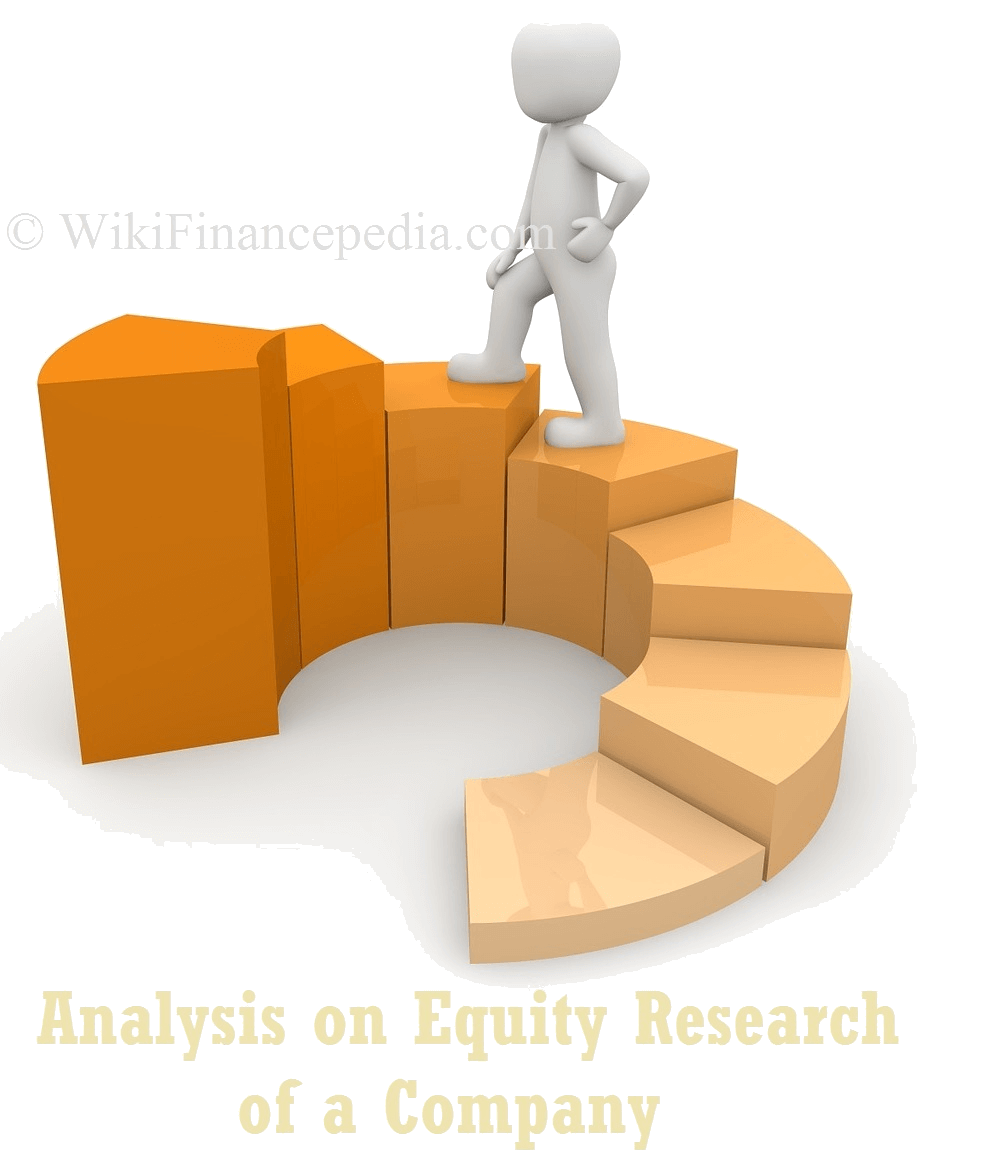
Equity Research Definition: Means every buy-side or sell-side firm has a division which deals with all the research done by a firm and their clients, which is called equity research. Along with the equities, the equity research also deals with commodities and bonds. The equity research provides insight and a detailed analysis of a company, […]
What is Equity Research? Definition, Examples, Analyst Report on Analysis Read More »