In this investigation, we will explore the meaning of the Fixed Asset Turnover Ratio, interpret its significance in various contexts, examine its relation to other financial metrics, and assess how businesses across different industries utilize it to gauge performance and competitiveness. Let us understand the fixed asset turnover ratio meaning with examples, analysis, formula in this topic.
It has simple calculations, but there could be serious repercussions. The ratio calculates revenue per unit of fixed assets used for a given time period. It does this by dividing net sales by average fixed assets. Decision-makers use this ratio in financial analysis. It helps them identify operational strengths and weaknesses. They also evaluate managerial efficacy with it. Additionally, it assists in making prudent resource and investment allocations.
Fixed Asset Turnover Ratio Definition
The ratio of net sales to fixed assets is known as fixed asset turnover ratio. It is calculated by analysts to determine the operating performance of a company. Basically this ratio accounts for the net sales a company can generate based on its fixed asset investments. They are -property, plant and equipment (PP&E), net of depreciation. A higher ratio indicates optimal utilization of investments in fixed assets and reflects the efficiency of a company’s human resources.
When a company starts making significant investments, all investors should monitor the Fixed-Asset Turnover ratio in the following years. This allows observing the efficiency of fixed assets. Manufacturing industries that make substantial purchases for PP&E use this ratio as a metric to scale up output.
Annually calculating the fixed asset turnover ratio reveals the proficiency of a company, particularly its financial management team, in generating income from the company’s fixed assets. Essentially, investments in fixed assets constitute the largest component of the company’s total assets.
Fixed Asset Turnover Ratio Analysis
A higher ratio indicates favorable efficiency in using assets to boost sales. A lower ratio suggests underutilization of fixed assets, indicating management or production problems that the company needs to address.
Now that you know the definition of fixed asset ratio, let’s walk you through the analysis and its formula. Net sales of a company will be equal to the average total assets for one accounting year if the ratio is one. In simple words, for every single rupee invested in assets, the company earn one rupee, more or less.
If you own a company in a particular industry, comparing the fixed asset turnover ratio with the competitive companies will give you a broad idea as to how well your management team is able to handle the assets. Because you see, similar to most ratios, the asset turnover ratio is in accordance to industry standards.
Investors and creditors gain insight into how a company manages and utilizes its assets to generate products and sales. As an investor, you want to monitor the usage of both fixed assets and current assets since you’re investing your money.
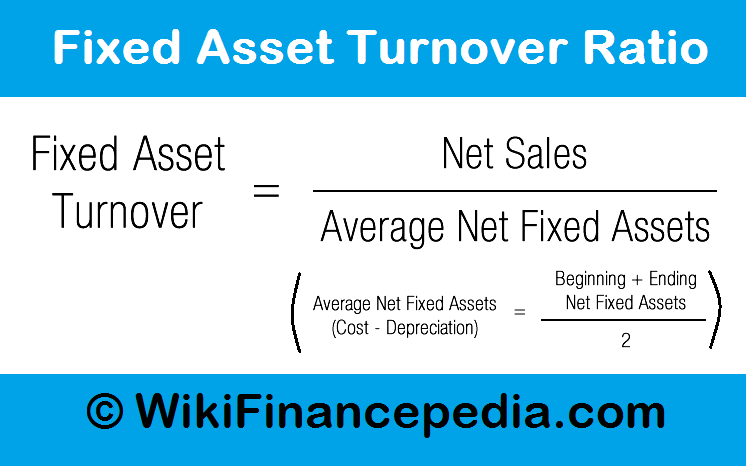
Fixed Asset Turnover Ratio Formula
The asset turnover ratio is calculated after dividing net sales by average total assets.
When calculating the ratio, it is imperative to exclude returns and refunds from total sales to accurately assess the company’s assets’ capacity to promote sales.
One of the simple ways to calculate average total assets is to add the initial and final total asset balances together and then divide them by two. This very method is based on a two-year balance sheet. A more in-depth, weighted average calculation can be used, but it is not essential.
Fixed Asset Turnover Ratio Example
Let’s take a simple example to understand how the fixed asset ratio is calculated.
A tech startup company develops utility software for mobiles and tablets. The company is called Wiki-tech. Wiki-tech needs a new investor to sponsor them. The co-founders schedule a meeting with an angel investor for this purpose. The investor is particularly interested in how well Wiki-tech utilizes its assets to generate revenue. He requests to see their financial statement.
Their financial statement reported the following :-
Beginning Assets = INR 50,000/-.
Ending Assets = INR 100,000/-.
Net Sales = INR 25,000/-.
The total asset turnover ratio is calculated by dividing INR 25,000 by (INR 100,000 and INR 50,000)/2.
The answer will be INR 0.33.
So, as you can very well see, the ratio is too less for profit generation. For every rupee wiki-tech spends on its assets, it merely earns INR 0.33. Investor won’t be much interested in collaborating with wiki-tech. However, if their net sales increase to INR 100,000, their ratio spikes to 1.3 and this will attract potential investors.
Conclusion
Finally, we must acknowledge that the Fixed Asset Turnover Ratio is merely one aspect of a more serious financial issue. Pairing additional financial metrics and performance indicators fully represents a company’s operational health and industry competitiveness. Furthermore, integrating these metrics enhances the comprehensiveness of the assessment.
Businesses need to develop a complex plan to enhance the Fixed Asset Turnover Ratio. This plan should combine strategic asset management, effective capital allocation, and operational efficiency improvements. They must continually assess their resource utilization, optimize workflows, and invest in equipment and procedures to boost productivity and earnings.
Read E-Learning Tutorial Courses - 100% Free for All